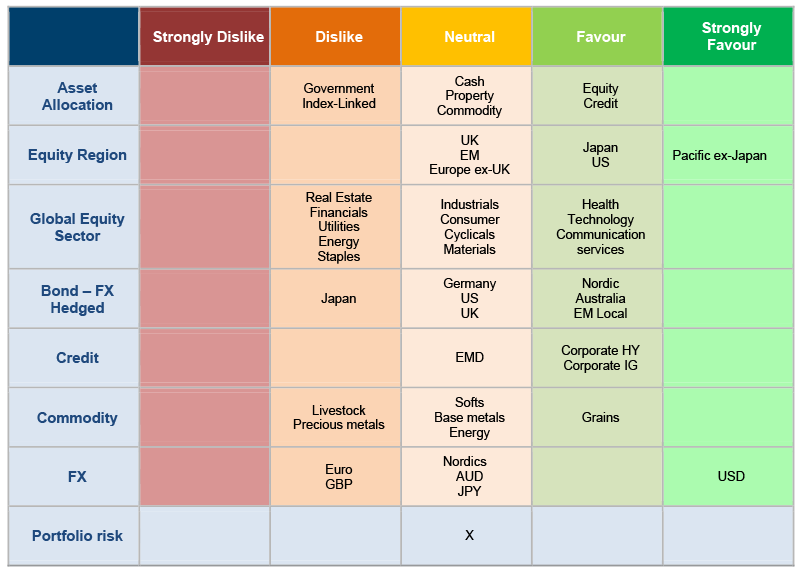
In a game of cards “standing pat” is to retain one’s hand as dealt, without drawing other cards. Standing pat also captures how we have managed our asset allocation in recent months, making few changes to our overall preferences. We continue to believe the best risk-adjusted returns will come from equities and corporate credit over the next 12-18 months, with persistent caution on core duration, and we are neutral towards cash, commodities and UK commercial property.
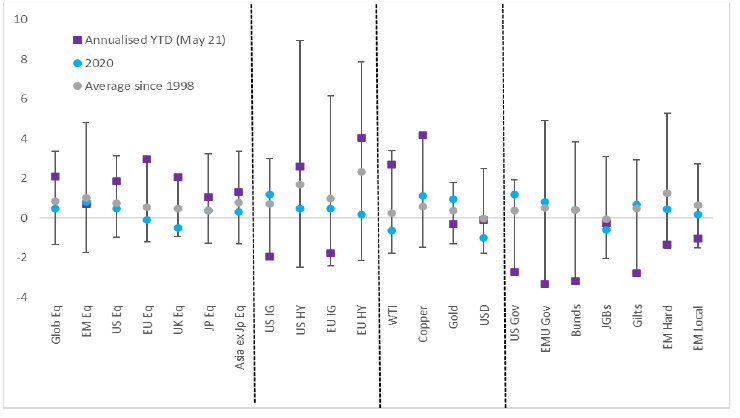
Figure 1: volatility-adjusted returns, January 1998 – May 2021

Source: Bloomberg, May 2021
More itinerant returns from financial markets in the first five months of the year have largely supported this positioning. Volatility-adjusted returns, or “Sharpe ratios”, have been punchy and well above respective medians and means in equities (and commodities), but exceedingly poor for long-duration fixed income assets, particularly government bonds (Figure 1)1. We have discussed ad nauseum why we judge developed market government bonds to be a remarkably poor source of return diversification – and with yields still historically low, locking in similarly low prospective returns, and growing fiscal profligacy, we take duration exposure sparingly across asset allocation funds.
Our allocations “under the bonnet” of broad asset class categories have been less fruitful, in two chief areas. First, in pointing our cyclical equity exposure towards Asian EM and Japan, which have lagged notably behind the UK and Europe; and second, in continuing to favour equally high-yield and high-grade corporate bonds, where returns have differed wildly. Let’s take a look at each in turn.
Kicking the tyres on equity regions
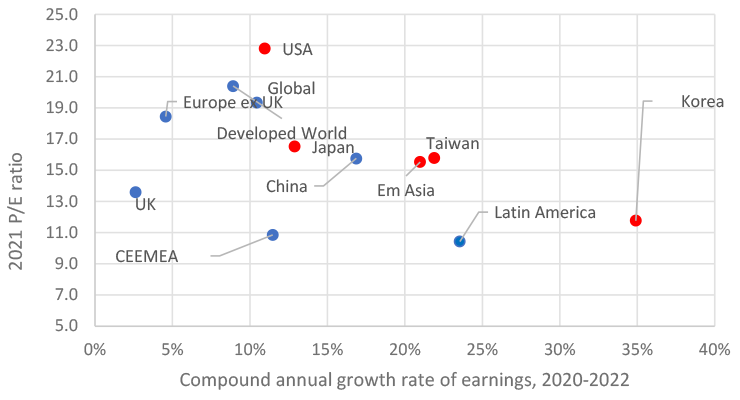
While the latter would almost certainly be widely disruptive for risk assets, our expectations are for only a metered tightening: the authorities learned their lesson from previous over-tightening in 2017 and 2018, and our Asian equity colleagues welcome the improved quality of Chinese growth and earnings as a result of recent measures. With strong, above-consensus earnings expected both this year and next – Asia and Japan are expected to comfortably deliver double-digit compounded earnings growth between 2020 and 2022 that is several turns greater than Europe or the UK – and at a globally competitive price, we have maintained exposures in weaker markets (Figure 2).
We also stay constructive on US equities, where strength in the first quarter earnings season has been fairly astonishing. Earnings for S&P 500 companies have grown by 50% year-on-year, more than twice the (elevated) expected 24%; unusually, analysts have been marking up forecasts as the quarter progressed. As in the last quarter, the market has used this reporting season as an opportunity to post modest total return gains and to also derate. S&P 500 revenues are 10% higher compared with a year ago, against expectations of 6%, and our US equity colleagues point to upside risks to both revenues and earnings growth for the year as a whole.
Figure 2: What do you pay for earnings growth?

Source: Citi research, Worldscope, MSCI, Factset, 24 May 2021. Red marks our favoured regions. Note: the above data are compiled based on companies in the MSCI AC World Index. The market capitalisation for regions, markets and sectors are free-float adjusted. P/E, EPS Growth, P/B, Dividend Yield and ROE are aggregated from Factset consensus.
Drilling deeper into grades of credit
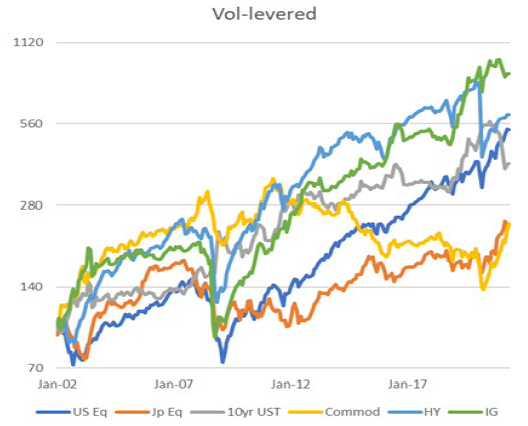
Total returns from high yield and high grade corporate bonds have also diverged meaningfully this year. To a degree this is driven by duration, which has fared poorly and impacts longer-maturity high grade much more than shorter-duration high yield. But it is also explained by differing underlying trends in risk. If one scales exposures across markets for the same level 12-month volatility (of, for example, the S&P 500), then high grade bonds have generated the best risk-adjusted returns by some distance – above both equities and high yield bonds (Figure 3).
Figure 3: Total returns, scaled by trailing 12-month volatility, 2002-2021

Source: Bloomberg, 24 May 2021. To create ‘same risk’ time series, scale exposures across markets so that each asset class volatility = 12-month SPX vol. Repeat next month, etc
After a weak first quarter, high grade bonds have treaded water, and given continued central bank support and significant improvements in underlying corporate fundamentals, we hold steady. We continue to direct our investments towards the excess spread offered by shorter-maturity European high yield bonds – which may be in a sweet spot from policy support, ongoing cyclical upswing and improving credit metrics, including dramatically lower default expectations for both this year and next, with higher expected recovery rates to boot.
Figure 4: Asset allocation snapshot

Source: Columbia Threadneedle Investment, 24 May 2021


