Stock markets: Looking ahead
Insights

Stock markets: Looking ahead

10% - As you read this article, remember this figure.

That’s the approximate average annual return of the S&P 500 Index, the standard measure of stock performance in the US, since its 1926 inception date.1 The key word here is average: there have been a lot of dramatic ups and downs over those 94 years. It is also testament to the power, consistency and resilience of the stock market — the rate is so robust that long-term returns for stocks have outpaced other major asset classes, such as bonds and commodities, by a wide margin.2 For investors who have committed to staying invested for the long term, the benefits have been generous.

Staying invested is, of course, easier said than done.
It often requires the fortitude to stay focused on investment goals that are years away when by-the-minute bad news is coming fast, and your losses are piling up. In the midst of confidenceshattering drops in the markets, it’s easy to lose sight of the fact that these types of events have occurred before, and that they can even lay the groundwork for opportunity.
The positive performance of stocks over time makes for a very attractive big picture. But when you zoom in, that picture can sometimes get ugly. Since its inception, the S&P 500 has experienced 11 instances of declines of 20% or more from an all-time high, which is generally considered to be a bear market. Each of these declines came out of a specific set of circumstances, and the duration of recovery has varied widely.
index

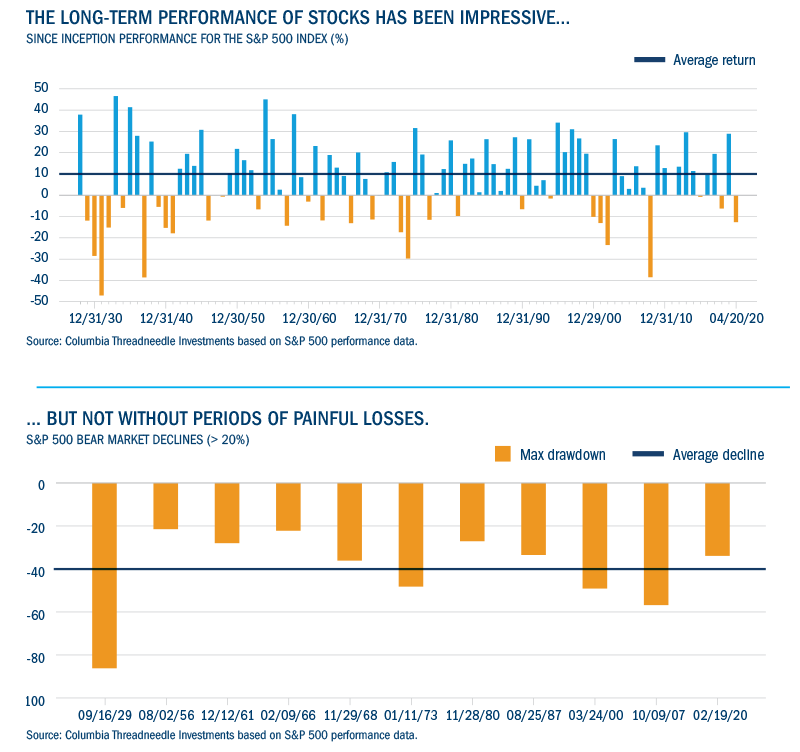
What have we learned from investing through bear markets?

First, that we are getting better at dealing with them. In the aftermath of each event, major market participants and regulators pushed through reforms related to market structure, trading and investing rules. And as we are experiencing a structural contraction yet again, we are also benefiting from these types of reforms. Monetary policy has also evolved. Aggressive and swift action by central banks is now common and expected — both to address the function of the market and to support investor confidence.
The second thing we learned is that markets recovered. The volatility (in both directions) was absorbed into the long-term, upward trend line. Investors who stayed the course felt the pain, but also benefited over the long run.
2020: navigating a pernicious pandemic—and its aftermath.
Though many features of the current market contraction are unprecedented, these lessons help us put things in perspective and suggest a likely path forward.
The root cause of the current market contraction is Covid-19’s global impact on normal business operations, governments and the financial system. It’s structural in nature, driven by fundamental economic disruptions that have eroded market value and investor confidence. The severity and duration of the market downturn are yet to be determined, but our success in addressing the cause of the current slide — the ongoing spread of a global pandemic — will be, in our view, the factor that sets us on a path to recovery. Looking at it this way makes the situation relatively uncomplicated. We have only one dragon to slay, the novel coronavirus, even if it is unprecedented and formidable.

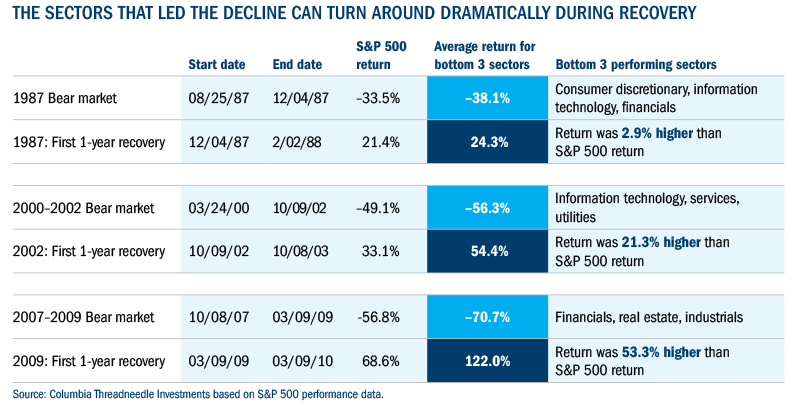
What recovery might look like

As we have noted, each decline has its own unique aspects, so the related recoveries are also unique. But based on observations and data for the most recent structural bear markets (1987, 2001–2002 and 2008–2009), we believe there are patterns that could recur — and that suggest certain strategic responses — as the markets begin to recover over the next months and years.
1. Defensive stocks tend to lag, while cyclical stocks tend to lead
A large dataset supports the idea that traditional defensive sectors — consumer staples, healthcare and utilities — tend to underperform in the early stages of a recovery, while stocks with cyclical sensitivity — financials, materials and industrials companies — tend to outperform. When we look at six-month and one-year returns after the three most recent bear markets, this pattern largely holds true.
It is important to note that in the current environment, we may see a variation on these trends. Certain healthcare stocks, which historically lagged, may be much stronger performers given the demand for testing, diagnostics, tools and products. There has also been an explosion in online consumption, whether it’s for groceries, education or broader retail. What started out of necessity for many may perhaps become the norm – and it will be important for investors to recognise these changes.
Index
2. Cyclical and value quantitative factors may perform better than momentum and growth factors
Factors are patterns of return that investors can isolate and seek to profit from; for example, small-cap stocks tend to outperform large caps over time. This approach is based on analysing systematic market observations rather than the specific characteristics of individual companies or sectors. During periods of recovery from bear markets, quantitative factors that focus on cyclical and value characteristics tend to outperform. Factors that target characteristics such as rising price momentum, profitability potential and growth rates tend to underperform.
Average factor performance graph
3. In the early days of a recovery, investors may avoid the sectors and industries that led the decline
It is hard to imagine now, but after the dot-com bubble burst, investors shied away from the tech sector for years — the memory of the pain it inflicted on their portfolios lingered. From a behavioral perspective, this makes sense. Recency bias, the tendency for people to emphasise current reality over past experiences and future planning, can skew decisions about the risks of investing in certain companies or sectors. In the current environment, it’s easy to understand why investors might avoid travel and hospitality stocks, which led the way down, because it may take longer for them to fully recover.
But for long-term investors, satisfying the urge to avoid sectors can be a strategic mistake, from both a diversification perspective and because of the potentially missed opportunities to add good long-term investments to a portfolio at attractive valuations. These missed opportunities were evident in the periods following the 1987, 2002 and 2009 market bottoms. To illustrate this, we can show the posttrough 12-month returns of the three sectors that led the downturns versus the S&P 500. In each case, the equal-weighted aggregate return of the three most “unloved” sectors outperformed the broader market.
The scetors that led the decline can turn around dramatically
4. Winners and losers sometimes defy easy classification
While the above arguments remain salient, taking advantage of rising markets during recovery is about more than getting the sector balance right. Aggregating returns by sector has the potential to mask the true nature of that sector’s performance: it’s often dominated by the outsize results of one company or a small group of businesses. When sectors outperform, it is rare that every stock in those sectors beats the market. Conversely, for sectors that underperform, not all stocks in the category lag.
This is one of the main reasons we believe active portfolio management can make a difference during market recoveries. It’s not sufficient to simply identify winning sectors, and it may be, to a certain extent, irrelevant. The best performing sectors do tend to have the highest number of stocks that exceed the performance of the S&P 500 over the same time period, but even the lowest performing sectors have a fair representation of companies that outperform the index.
Opportunity can vary within sectors
For the recovery periods following the 1987, 2001-2002 and 2008-2009 bear markets:
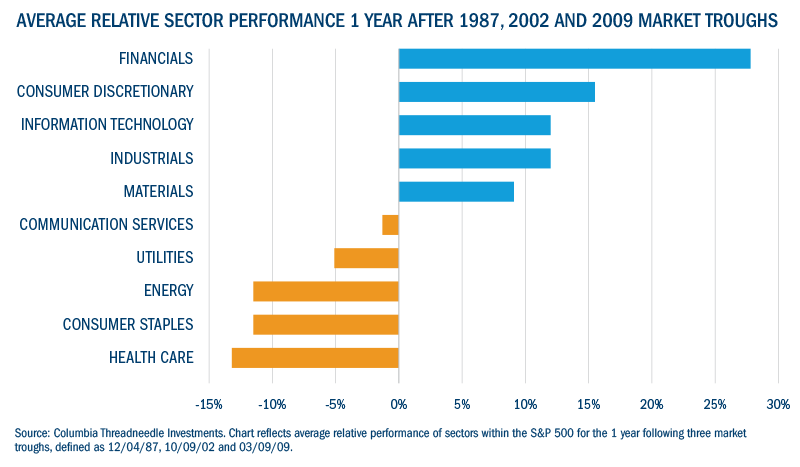
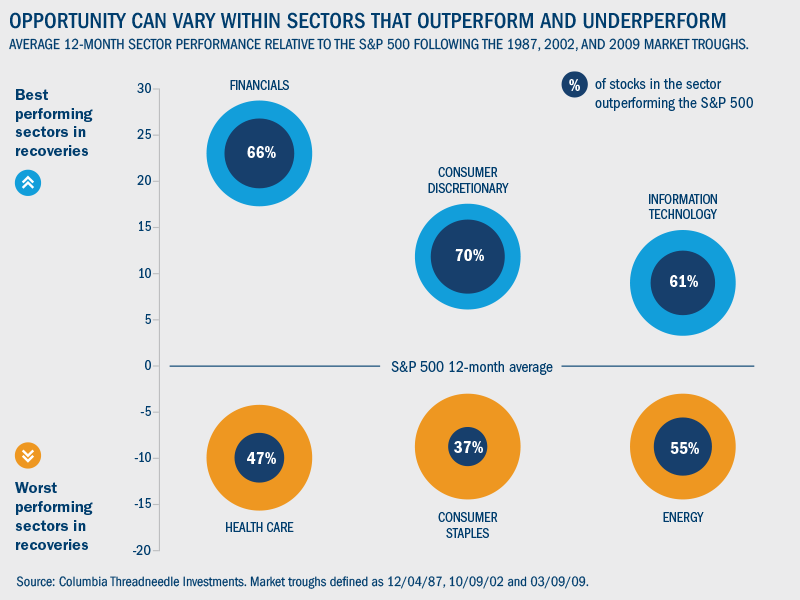
  • Financials, consumer discretionary and information technology were winning sectors in aggregate. But hit rates — the percentage of stocks that outperformed — within those sectors were 66%, 70% and 61%, respectively, relative to the entire market over the 12-month post-trough period.
  • Healthcare, consumer staples and energy sectors underperformed in aggregate, but hit rates within those sectors were still 47%, 37% and 55%, respectively, relative to the entire market over the 12-month post-trough period.
5. It may pay to focus on quality in fixed income
Though observations so far have been about the behavior of stocks, fixed-income portfolio allocations also play an important part in investors’ recovery strategies.
History and common sense tell us that a flight-to-safety from equities is directed to cash and high-quality bonds. But in the first phase of the current crisis, high-quality (investment-grade) bonds performed surprisingly poorly, with some of the most defensive sectors performing as badly as low quality, lower rated, high-yield bonds. This was driven by a lack of market liquidity as well as concerns about underlying credit quality.
Moreover, price declines and outflows in high-quality bonds experienced early in the current crisis differ from the pattern experienced during prior market downturns.
Note that aggregate high-yield bond average returns are not available for the 1987 downturn and recovery as the market was in its very early days, so we illustrate only the 2002 and 2009 corrections and subsequent recoveries.
With this in mind, the decline in investment-grade bond prices that we have seen appears to be an aberration. In our view, high-quality bonds, especially in defensive market sectors like utilities and consumer staples, will likely revert to a more normal performance relationship relative to low-quality bonds, and then follow a path similar to previous contractions and recoveries. This is not to say all investment-grade companies and industries are immune to downgrades or worse, but the important point is our conviction that exposure to high-quality bonds can help investors mitigate downside risk in a challenging, recessionary environment.
The average historical performance of high-yield bonds in the chart below shows a similar pattern to equities during both the downturns and the recoveries. For investors with an appetite for the increased default risk, maintaining a strategic allocation to lower quality, higher yielding bonds through bear markets can also be advantageous when the markets rebound.
Bond returns during and after two major market corrections
What about cash?
Some investors are tempted to reallocate to cash until there is less uncertainty, but if you aren’t invested, you don’t get to participate when markets rebound – which can happen quickly and violently.
In the 8 years following the global financial crisis, cash returned less than 0.25% annualized. Safe, liquid … and the worst performing asset class.
6. Volatility is likely to continue
The CBOE Volatility Index (VIX) is a measure of stock market volatility. During the 2008-2009 global financial crisis, a spike in the VIX was followed by a series of “aftershocks” as it moved back toward normal levels. If we follow a similar pattern in the current environment, we could continue to see episodes of volatility — sometimes dramatic — for an extended period. Subsequent to their peak, these episodes will likely decrease in frequency and magnitude, but they can still be unnerving and costly in the short term.
Index

Conclusion

Each of the past 11 bear markets left an indelible mark on the economy and on investors’ psyches. This one will too. It might be hard to imagine what recovery may look like, especially during what will likely be more difficult months ahead. Past performance is not a guarantee of future results, but if markets hold true to well-established norms, bear market number 12 will pass, the lessons learned will be added to the data from the first 11, and year 95 will be added to the S&P 500 Index average.
To be sure, it can take stocks years to return to their prior highs from bear market lows, especially when a recession is part of the formula. And even then, it is unlikely we will return to a world that’s the same as it was prior to this shock. It is very likely that after the world contains the novel coronavirus, we will see structural changes and an acceleration of trends that were already in play. The healthcare and energy industries were arguably already headed toward a fundamental transformation, and their performance over the upcoming months may look very different from prior recoveries.
Responding to these impacts and thriving through the decline and into the recovery will require intensive research at both the macro and company-by-company level into what those lasting structural changes may be and how we react to them. And while we regroup and strategise next steps, we have to be nimble, but also vigilant in adhering to our long-term, positive view of the markets — and the opportunities they will continue to provide for committed investors.

Important information: For use by Professional and/or Qualified Investors only (not to be used with or passed on to retail clients). Past performance is not a guide to future performance. Your capital is at risk. The value of investments and any income is not guaranteed and can go down as well as up and may be affected by exchange rate fluctuations. This means that an investor may not get back the amount invested. This document is not investment, legal, tax, or accounting advice. Investors should consult with their own professional advisors for advice on any investment, legal, tax, or accounting issues relating to an investment with Columbia Threadneedle Investments. The analysis included in this document has been produced by Columbia Threadneedle Investments for its own investment management activities, may have been acted upon prior to publication and is made available here incidentally. Any opinions expressed are made as at the date of publication but are subject to change without notice and should not be seen as investment advice. This document includes forward looking statements, including projections of future economic and financial conditions. None of Columbia Threadneedle Investments, its directors, officers or employees make any representation, warranty, guaranty, or other assurance that any of these forward-looking statements will prove to be accurate. Information obtained from external sources is believed to be reliable, but its accuracy or completeness cannot be guaranteed. Issued by Threadneedle Asset Management Limited. Registered in England and Wales, Registered No. 573204, Cannon Place, 78 Cannon Street, London EC4N 6AG, United Kingdom. Authorised and regulated in the UK by the Financial Conduct Authority. This document is distributed by Columbia Threadneedle Investments (ME) Limited, which is regulated by the Dubai Financial Services Authority (DFSA). For Distributors: This document is intended to provide distributors’ with information about Group products and services and is not for further distribution. For Institutional Clients: The information in this document is not intended as financial advice and is only intended for persons with appropriate investment knowledge and who meet the regulatory criteria to be classified as a Professional Client or Market Counterparties and no other Person should act upon it. Columbia Threadneedle Investments is the global brand name of the Columbia and Threadneedle group of companies.

23 June 2020
Columbia threadneedle investments logo
Columbia Threadneedle Investments
Share article
Share on linkedin
Share on email
Key topics
Related topics
Listen on Stitcher badge
Share article
Share on linkedin
Share on email
Key topics
Related topics

PDF

Stock markets: Looking ahead

1 Source: Columbia Threadneedle Investments. Past performance is not a guarantee of future results. Investors cannot invest directly in an index.

2 Sources: https://www.nasdaq.com/articles/stocks-bonds-bills-inflation-returns-for-the-94-years-ending-december-2019-2019-12-09

https://www.cfainstitute.org/-/media/documents/book/rf-publication/2012/rf-v2012-n1-1-pdf.ashx

3 Sources: https://www.nasdaq.com/articles/stocks-bonds-bills-inflation-returns-for-the-94-years-ending-december-2019-2019-12-09
https://www.cfainstitute.org/-/media/documents/book/rf-publication/2012/rf-v2012-n1-1-pdf.ashx For the purposes of this paper bear markets are calculated as drops from all-time market highs based on total return of the S&P 500. By this calculation, the following periods have been defined as bear markets:
1987 Bear Market: 8/25/1987 – 12/4/1987 (S&P 500 return -33.5%)
2000-2002 Bear Market: 3/24/2000 – 10/9/2002 (S&P 500 return -49.1%)
2007 – 2008 Bear Market: 10/9/2007 – 3/9/2009 (S&P 500 return -56.8%)
Periods of 20% declines that are not from all-time highs are excluded from calculations, as are price declines of greater than 20%.

Factor performance is established by taking the universe of stocks in the S&P 500 and ranking those stocks based on the criteria provided below to create portfolios that are long the top 20% of securities and short the bottom 20% of securities.
Value – Book Equity/Market Cap.
Volatility – The square root of the 125-day average of a stock’s absolute return divided by the cross-sectional volatility of the market.
Size – Natural log of market cap
Profitability – A Linear combination of six factors: return on equity, return on assets, cash flow to assets, cash flow to income, gross margin, sales to assets.
Momentum – A stock’s cumulative return over the last 250 trading days.
Leverage – An equal-weighted average of debt-to-assets and debt-to-equity.
Growth – An equal weighted average of earnings growth rate and sales growth rate.
Dividend Yield – Trailing 12-month Dividends Paid/Market Cap.
Earnings Yield – A weighted average of realized earnings-to-price (75%) and forecasted earnings-to-priced (25%).

Bloomberg Index Services Limited. BLOOMBERG® is a trademark and service mark of Bloomberg Finance L.P. and its affiliates (collectively “Bloomberg”). BARCLAYS® is a trademark and service mark of Barclays Bank Plc (collectively with its affiliates, “Barclays”), used under license. Bloomberg or Bloomberg’s licensors, including Barclays, own all proprietary rights in the Bloomberg Barclays Indices.

Neither Bloomberg nor Barclays approves or endorses this material, or guarantees the accuracy or completeness of any information herein, or makes any warranty, express or implied, as to the results to be obtained therefrom and, to the maximum extent allowed by law, neither shall have any liability or responsibility for injury or damages arising in connection therewith. Not all products and share classes are available through all firms.

Important Information

The research and analysis included on this website has been produced by Columbia Threadneedle Investments for its own investment management activities, may have been acted upon prior to publication and is made available here incidentally. Any opinions expressed are made as at the date of publication but are subject to change without notice and should not be seen as investment advice. Information obtained from external sources is believed to be reliable but its accuracy or completeness cannot be guaranteed.

Related Insights

28 March 2024

The Good, the Bad and the UK Stock Market

After an exceptional 2022 the UK stock market reverted to type, underperforming in 2023. With money continuing to disappear from the market, two potential catalysts for change have emerged.
Read time - 5 min
22 March 2024

Harry Waight

Portfolio Manager

Simon Haines

Portfolio Manager

Japan: we’re more convinced than ever

Investors are increasingly turning their attention to Japan. We spent two weeks there and met dozens of companies. But which businesses look best placed?
Watch time - 6 min
20 March 2024

Krishan Selva

Client Portfolio Manager

Lin Jing Leong

Senior Sovereign Analyst, Emerging Market Asia

China: bottom-up opportunity as the macro picture slowly improves

While the top-down story has challenges, the notion that China is ‘uninvestable’ is in our view misinformed. We believe company-specific opportunities can be found by looking at trade, value for money and capital return.
Read time - 5 min
28 March 2024

The Good, the Bad and the UK Stock Market

After an exceptional 2022 the UK stock market reverted to type, underperforming in 2023. With money continuing to disappear from the market, two potential catalysts for change have emerged.
Read time - 5 min
26 March 2024

Fixed Income Desk

In Credit - Weekly Snapshot

In Credit Weekly Snapshot – March 2024

Our fixed income team provide their weekly snapshot of market events.
Read time - 5 min
26 March 2024

Ebele Conroy

Investment Analyst, Global Research

Joe Horrocks-Taylor

Senior Associate, Analyst, Responsible Investment

Green machines: the future of transport

The transportation sector has a significant impact on global emissions, but technology innovations, policy changes and shifting behaviours can reduce this. How are the different modes progressing?
Read time - 5 min
true
true

Important Information

The research and analysis included on this website has been produced by Columbia Threadneedle Investments for its own investment management activities, may have been acted upon prior to publication and is made available here incidentally. Any opinions expressed are made as at the date of publication but are subject to change without notice and should not be seen as investment advice. Information obtained from external sources is believed to be reliable but its accuracy or completeness cannot be guaranteed.

You may also like

Investment approach

Teamwork defines us and is fundamental to our investment approach, which is structured to facilitate the generation, assessment and implementation of good, strong investment ideas for our portfolios.

Funds and Prices

Columbia Threadneedle Investments has a comprehensive range of investment funds catering for a broad range of objectives.

Our Capabilities

We offer a broad range of actively managed investment strategies and solutions covering global, regional and domestic markets and asset classes.